The line item that moved
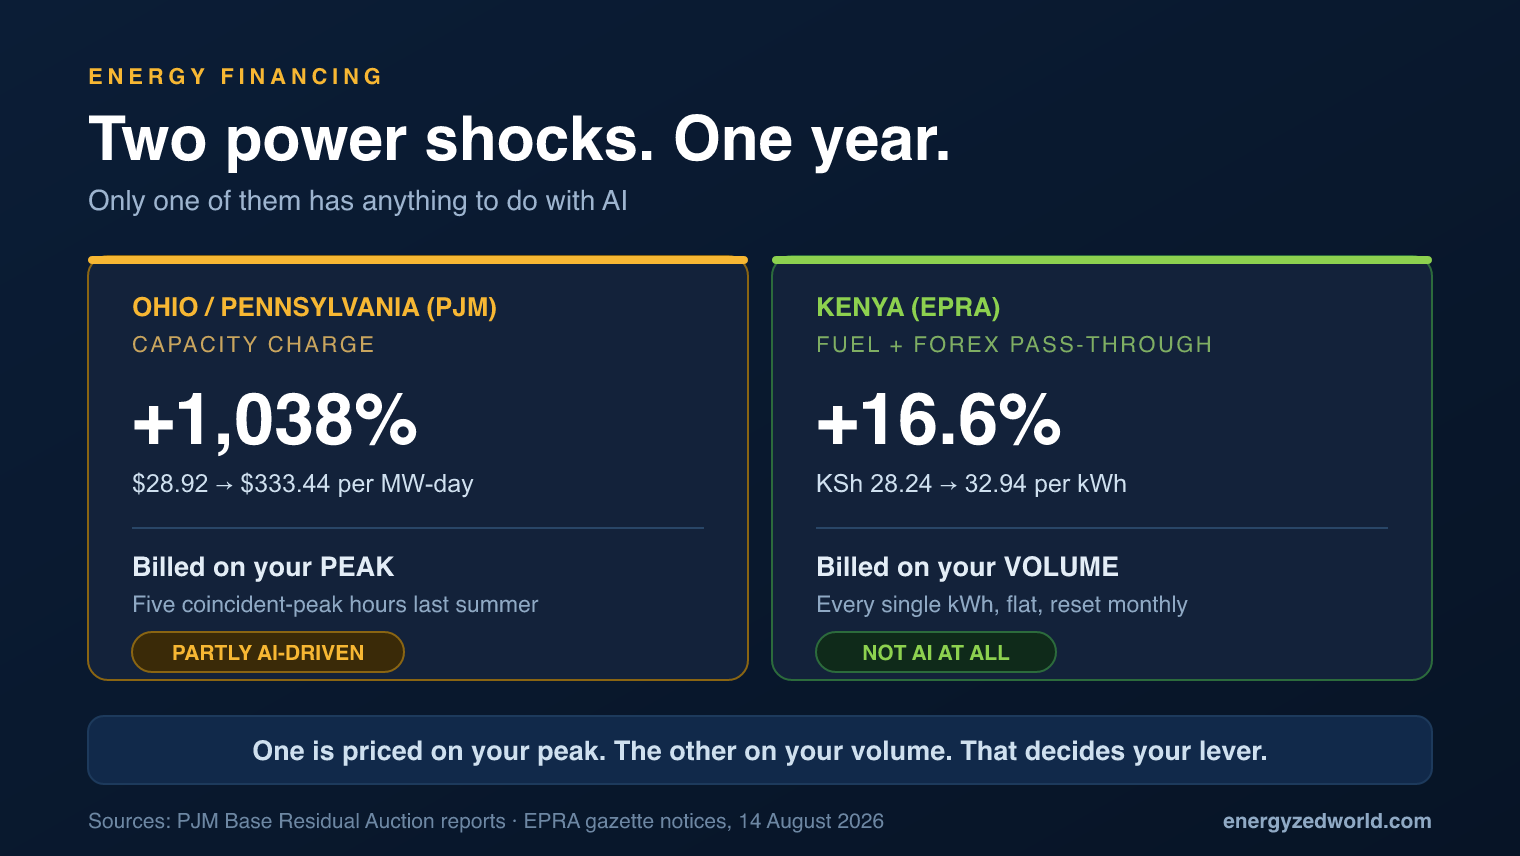
Across PJM — the grid region covering most of America’s manufacturing heartland, from Chicago to northern Virginia to New Jersey — the wholesale price of capacity has risen more than tenfold in two years, and data centres built to run AI are the largest single new source of the demand behind it. Capacity is not the electricity a plant consumes. It is the standby promise that enough generation will exist when the grid peaks, procured through an annual auction and billed to commercial and industrial customers as a separate line. As of August 2026 that price has gone from $28.92/MW-day for delivery year 2024/2025 to $329.17 for 2026/2027 and $333.44 for 2027/2028 — with every zone clearing at the administrative cap. The bills have already landed on manufacturers who had no part in the decision: at Belden Brick in Sugarcreek, Ohio, a 141-year-old brickmaker, the monthly capacity charge went from about $1,600 to $12,000; at Plaskolite, an Ohio plastics manufacturer, from $200,000 a year to $1.2 million. But in the very same month, an industrial plant in Nairobi absorbed a KSh 4.70 per unit increase with no AI in it whatsoever — and that contrast is the most useful thing in this story, because the two shocks are priced on completely different things and therefore respond to completely different levers.
Capacity is not energy, and that is the whole story
Most operators read their bill as one number divided by kilowatt-hours. That habit hides what is actually happening, because the steepest increases are not in the cents-per-kWh energy rate at all. They are in the components that price your contribution to the system peak.
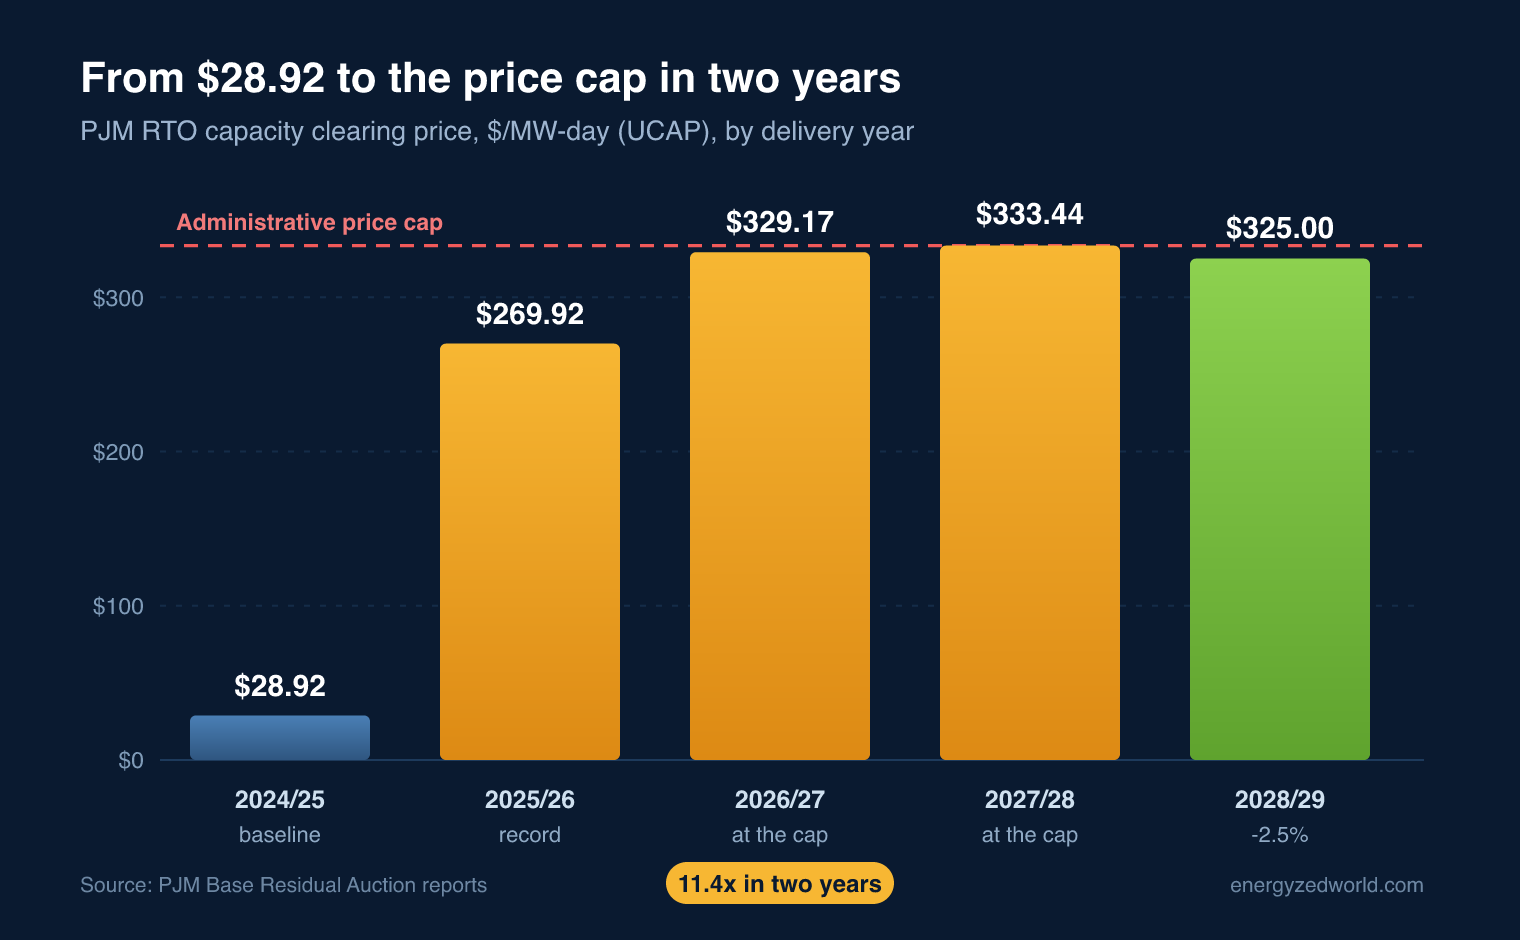 PJM capacity clearing prices, from PJM’s own Base Residual Auction reports.
Two details in that chart matter more than the headline multiple.
First, when every zone clears at the cap, the cap is setting the price, not the market. PJM’s 2027/2028 report is explicit that 809.6 MW of unforced capacity failed to clear because its offers sat above the temporary cap of $333.44/MW-day. A market that clears at its ceiling is telling you it has not found the price at which enough supply shows up.
Second, the 2028/2029 auction came in slightly lower, at $325/MW-day. That is the first sign of supply responding. It is not a peak until it is followed by another one, and I would not build a budget on it.
The bills that made this real
Abstract auction prices do not move anyone. Specific invoices do.
- Belden Brick, Sugarcreek, Ohio — in business 141 years — saw its monthly capacity charge go from roughly $1,600 to $12,000. Its total power cost rose about 90% in a year.
- Plaskolite, an Ohio plastics manufacturer, saw capacity charges go from about $200,000 a year to $1.2 million.
The pattern is regional, not anecdotal. Reuters, working from US Department of Energy data, found average industrial electricity prices as of December 2025 up 31% in Pennsylvania and 26% in Ohio year on year, against roughly 7% nationally for industrial users.
That gap — 26 to 31% against 7% — is the number to sit with. It says the cost is not being spread evenly across the country. It is concentrating where the data centres are, and it is landing on the industrial class with the least ability to pass it through.
How much of this is actually AI?
This is where most coverage stops being useful, so let us be specific.
The best available estimate is Dallas Fed working paper 2606, Processing Power: The Effect of Data Centers on Wholesale Electricity Markets (Kay, Reaser and Taylor, March 2026). Using an hourly, unit-level least-cost dispatch model of the continental US, it finds that existing data centres have already raised wholesale prices 3 to 5% on average nationwide, with substantially larger effects in the regions hosting major corridors. Extended through 2028: a high-utilisation build-out of what has been proposed implies roughly 50%, a moderate build-out roughly 20%.
Note what that does and does not say. Three to five percent nationally is not what turns $1,600 into $12,000. The rest of that jump comes from things that are boring and real:
- Capacity market reform. PJM changed how it counts the reliability contribution of intermittent and thermal resources, which raised the effective requirement.
- Retirements outrunning replacements. Firm generation left the stack faster than new firm generation joined it.
- A binding price cap. When the cap binds, the clearing price stops being a market signal and starts being an administrative one.
So: data centres are a genuine and growing driver, they are the reason the demand forecast keeps moving, and they are not the sole author of your invoice. Both things are true. Anyone selling you a solution based only on the first half is selling you something.
And the structural problem underneath it is not demand — it is the mismatch in clock speeds. A hyperscale campus can go from site selection to energised in roughly the time it takes to permit a substation. New dispatchable generation, and the transmission needed to move it, takes the better part of a decade. PJM itself is now developing frameworks to let large new loads connect but operate flexibly when the system is tight, which is a fair description of a grid operator managing the gap rather than closing it.
Meanwhile in Kenya: a KSh 4.70 shock with no AI in it
Now the counterweight, and the reason I am not writing a post that simply blames AI for expensive electricity.
In the same month those American invoices landed, EPRA gazetted three variable adjustments in Kenya totalling KSh 4.7027 per kilowatt-hour, effective for August 2026 meter readings. Not one shilling of it has anything to do with data centres.
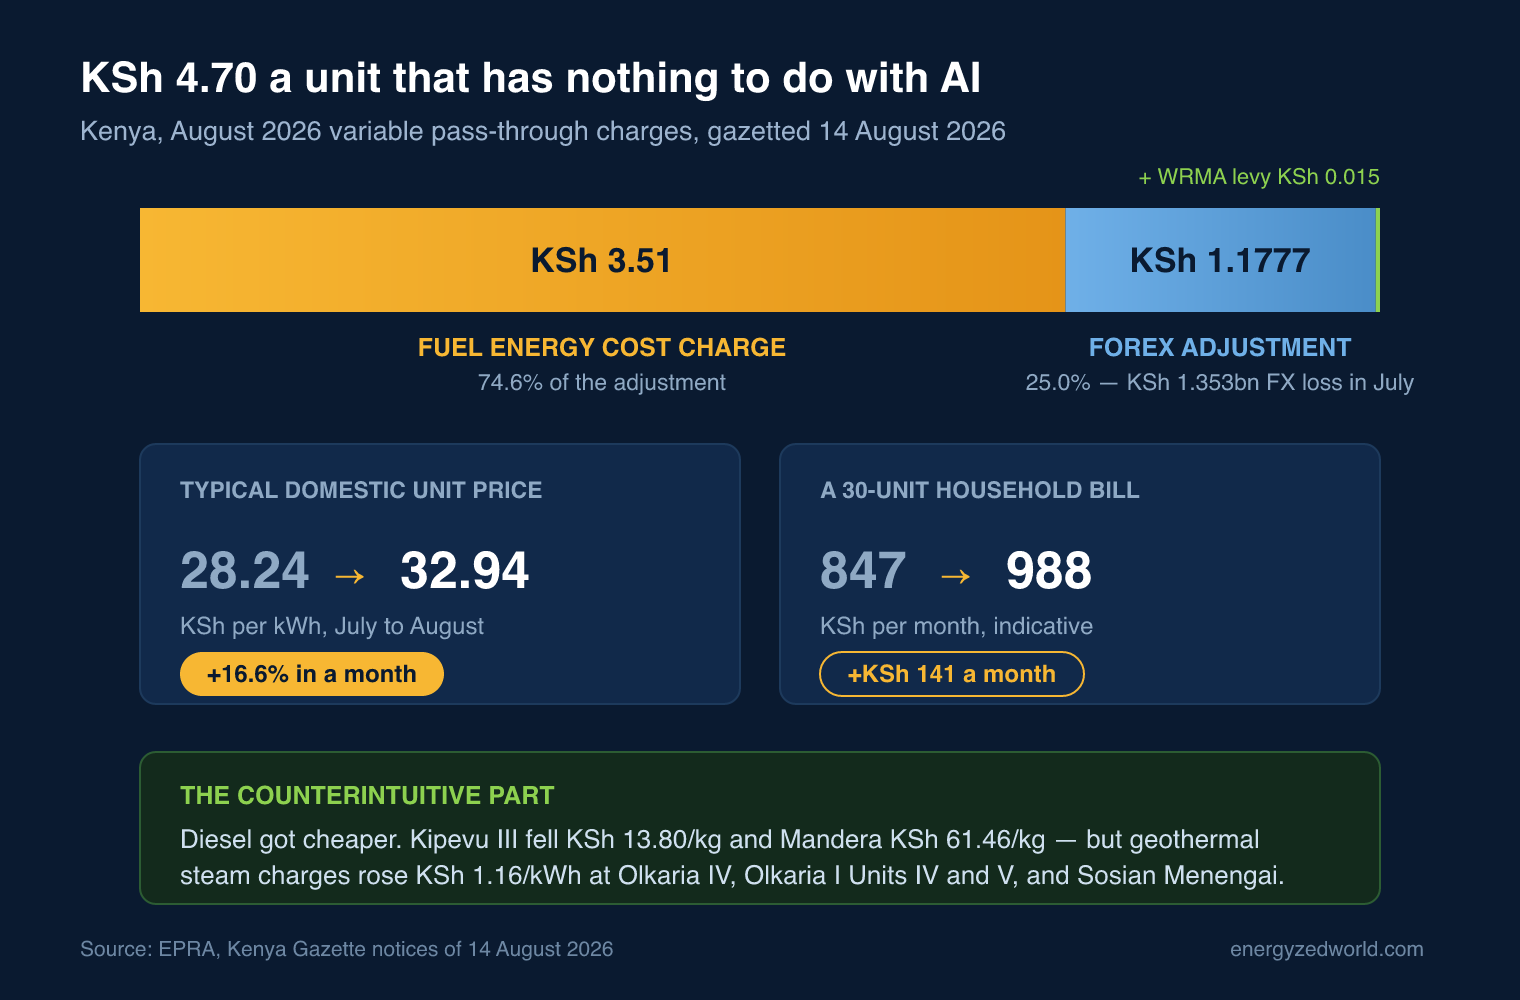 Kenya’s August 2026 variable adjustments, gazetted 14 August 2026.
The composition is the interesting part:
- Fuel Energy Cost Charge: KSh 3.51/kWh — about three quarters of the adjustment, calculated from the previous month’s generation and purchase data (1.376 billion kWh in July, excluding exports).
- Foreign Exchange Fluctuation Adjustment: KSh 1.1777/kWh — reflecting a combined KSh 1.353 billion exchange loss booked in July by KenGen, Kenya Power and the independent power producers, with the IPPs alone accounting for KSh 1.039 billion.
- WARMA levy: KSh 0.015/kWh — a water resource levy on energy bought from hydro plants of 1 MW and above.
Applied to a typical domestic tariff, that moved the indicative unit price from about KSh 28.24 to KSh 32.94 — roughly 16.6% in a single month. For a 30-unit household, about KSh 847 becomes about KSh 988. For an industrial consumer pulling hundreds of thousands of units, do the arithmetic yourself; it is not small.
And here is the detail that should stop anyone from reaching for a simple story: diesel actually got cheaper that month. Fuel prices fell at several plants — Kipevu III by KSh 13.80 per kilogramme, Mandera by KSh 61.46. What pushed the fuel charge up was geothermal steam charges rising KSh 1.16/kWh at Olkaria IV, Olkaria I Units IV and V, and Sosian Menengai. A renewable input drove a “fuel” increase.
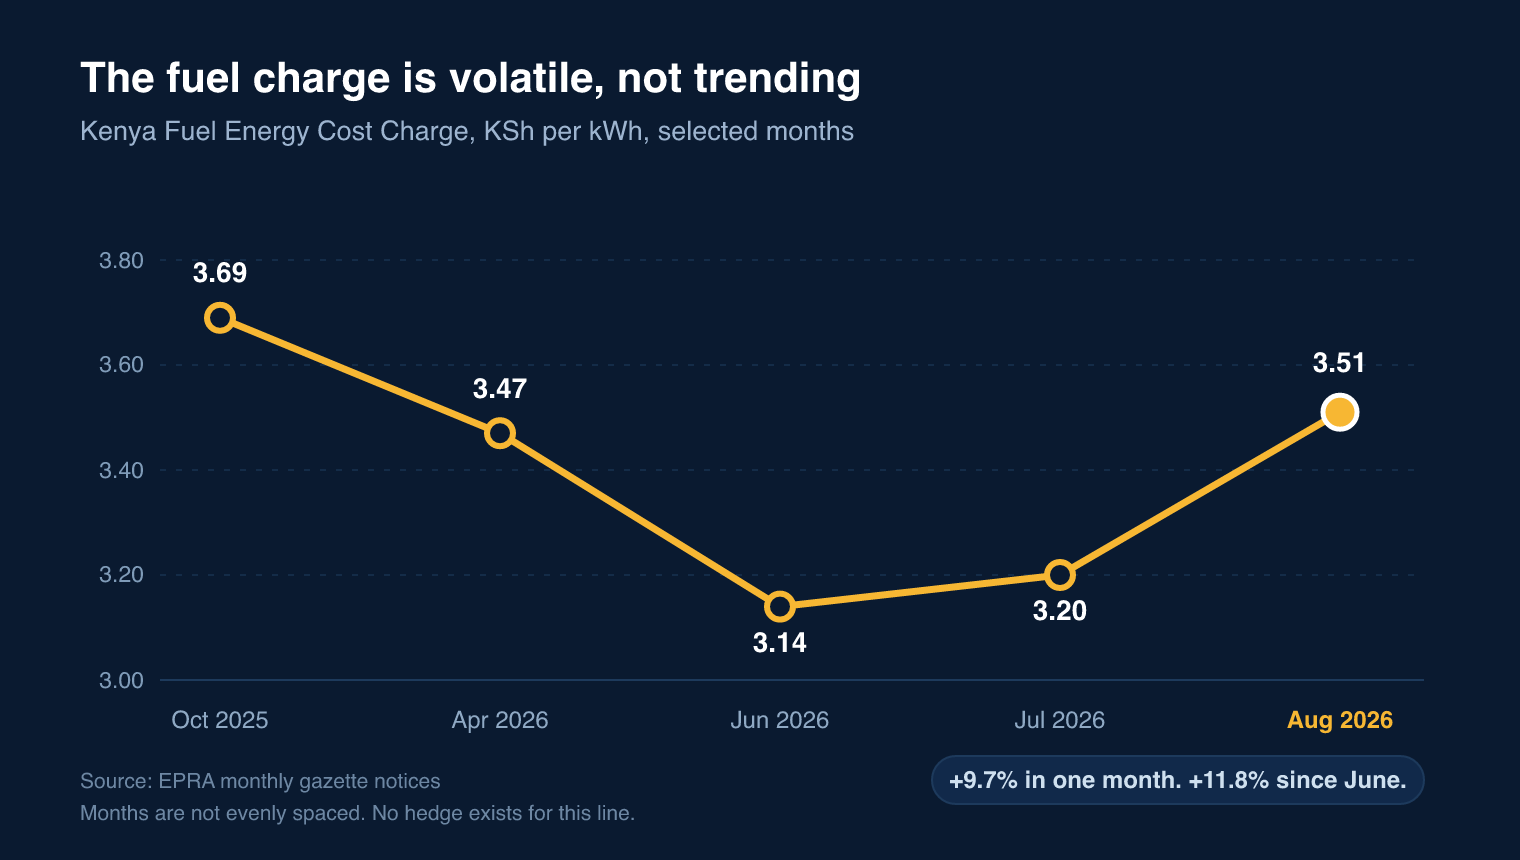 The fuel charge does not trend. It oscillates — and there is no forward market in which to hedge it.
Look at the shape of that line. It is not a ramp; it is a saw. KSh 3.69 in October 2025, down to KSh 3.14 by June 2026, back up to KSh 3.51 in August — up 9.7% in one month and 11.8% since June. You cannot plan against it, you cannot hedge it, and it resets every single month by gazette notice.
One is priced on your peak. The other on your volume.
Put the two shocks side by side and the practical lesson appears immediately.
 Two shocks, two playbooks. The billing basis is what decides your response.
A peak-priced charge responds to being small in a handful of specific hours. PJM capacity is set by your Peak Load Contribution — your average demand across the five highest system-load hours of last summer. Shave those and the charge falls for twelve months, whether or not your annual consumption changes at all.
A volume-priced charge responds only to using fewer units. Kenya’s fuel and forex adjustment applies flat to every kilowatt-hour. Shifting a compressor from 14:00 to 02:00 does nothing to it — the KSh 4.70 rides along either way. Only elimination works: efficiency, power factor correction, leak repair, switching off what nobody is using.
This is where I see real money wasted in both markets. Plants pull the peak lever against a volume-priced charge and wonder why the bill did not move. Or they chase kWh reduction against a capacity charge that was locked in by five hours last July. The diagnostic question is not “how do we cut energy costs” — it is “which of my line items is priced on peak, and which on volume?” Everything follows from that.
Find the charge, then pick the lever
The sequence matters more than the tactics.
- Pull twelve months of bills and split them into energy, capacity, transmission, demand (kW or kVA), and pass-through adjustments. If your supplier bundles capacity into a single all-in rate, ask for the unbundled breakdown.
- Label each line: peak-priced or volume-priced. This is the whole diagnostic. In PJM, capacity and transmission are peak-priced. In Kenya, the demand charge in KSh/kVA is peak-priced while the fuel, forex and levy adjustments are volume-priced.
- For the peak-priced lines, find the hours. In PJM your PLC comes from the five coincident peaks of the prior summer. One unmanaged July afternoon can price twelve months.
- Get interval data at the main incomer. Monthly bills tell you that you have a problem. Interval data tells you which hour, which line, which compressor — see what a data acquisition system actually is.
Then choose:
| Lever | Works against | Capital | The honest caveat |
|---|---|---|---|
| Peak-hour curtailment | Peak-priced only | Near zero | Requires forecasting which days matter and the authority to act fast. Free in capital, expensive in discipline. |
| Demand response enrolment | Peak-priced only | Low | You take on a performance obligation with penalties. Do not enrol capacity you cannot actually shed. |
| Power factor correction | Peak-priced (kVA markets) | Low | Straightforward win where you are billed on kVA rather than kW. Does nothing against a per-kWh pass-through. |
| Efficiency and load elimination | Both | Low to medium | The only lever that touches a volume-priced charge. Unglamorous, and the one most often skipped. |
| Fixed-term supply contract | Neither, really | Zero | Buys predictability, not savings — the forward curve already prices what you just read. And in Kenya there is no forward market for the fuel charge at all. |
| On-site generation / solar + storage | Both | High | Storage is strong against peak-priced charges because it discharges in the hours that count; solar is strong against volume-priced ones because it displaces units. Size against a measured profile, never a nameplate assumption. |
The order is deliberate. The cheapest reduction available to almost every plant is behavioural, and it is worth proving before anything is bought. The 2026 investment data backs this up: most organisations require payback inside five years and a large minority inside two, which structurally favours the fast, measurable, low-capital measure over the heroic retrofit — a point I dug into in the 2026 Energy Efficiency Investment Report review.
The deeper point is the one the two charts make together. In Ohio, a cost that was comfortably bundled inside a stable supply rate for two decades has surfaced, and manufacturers are being asked to build a muscle they never needed. In Kenya, that muscle was never optional — the demand charge has always sat on the face of the bill, and the fuel charge has always moved monthly. Same levers, same tooling, same constraint. You cannot manage what you cannot see, and you cannot fix what you have not correctly diagnosed.
Sources
- PJM, 2027/2028 Base Residual Auction Report (December 17, 2025) — clearing at the $333.44/MW-day cap; 809.6 MW unable to clear above it.
- PJM, 2026/2027 Base Residual Auction Report (July 22, 2025) — RTO price rising from $269.92 to $329.17.
- PJM Inside Lines, 2028/2029 capacity auction results (July 2026) — $325/MW-day and continued data-centre load additions to the forecast.
- Federal Reserve Bank of Dallas, Working Paper 2606: Processing Power: The Effect of Data Centers on Wholesale Electricity Markets — Kay, Reaser and Taylor, March 20, 2026.
- Reuters, “Big Tech data centers are driving up power bills at America’s Rust Belt factories” (July 7, 2026) — the Belden Brick and Plaskolite figures, and the state-level industrial price comparison.
- US Energy Information Administration, Electric Power Monthly — industrial electricity price series by state.
- Pulse Kenya, “EPRA sets August power adjustments at Sh4.70 per unit” (August 17, 2026) — the gazette breakdown, plant-level fuel and steam movements, and the KSh 1.353bn exchange loss.
- The Star, “Electricity bills set to rise on fuel, forex charges increase” (August 21, 2026) — indicative unit-price impact and KNBS inflation context.