A building can have a beautiful dashboard and still waste energy every night.
That is the tension I keep coming back to when thinking about AI and energy monitoring: collecting data, deciding what to change, and proving the change worked are three different jobs.
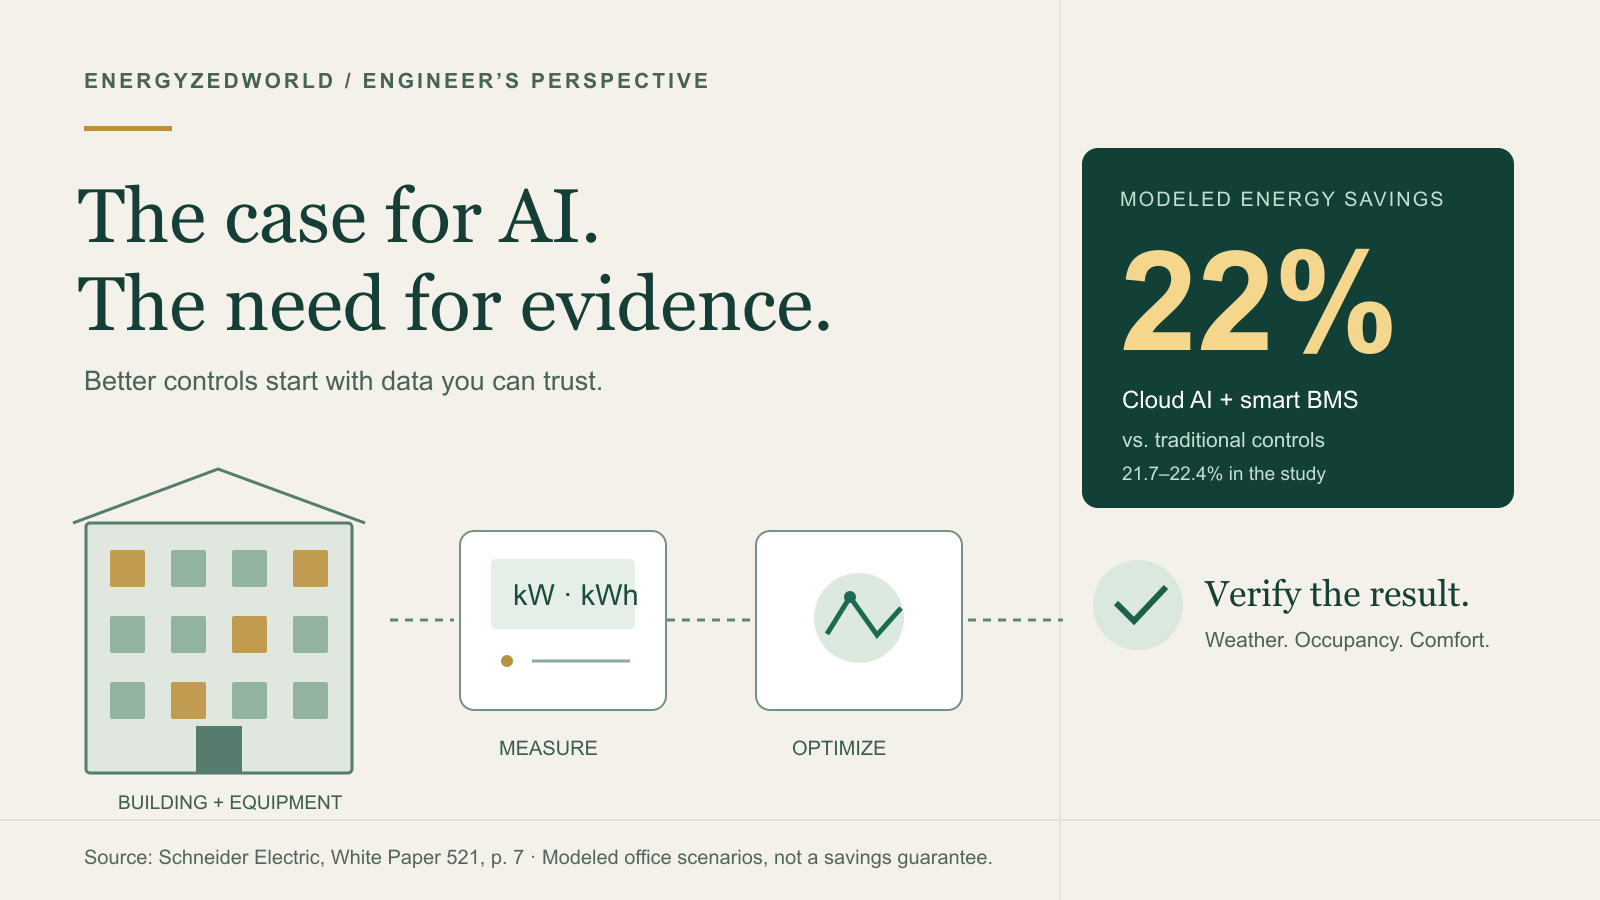
Facilities Dive’s September 29 report caught my attention with a striking number: AI-enabled building management could reduce energy use by around 22%. I went into the underlying Schneider Electric white paper to understand what sits behind it.
My work as an engineer spans energy monitoring and the application of AI to energy management. I find this research encouraging. It also reinforces where I would start a project: with a measurement plan that can tell us whether the optimization is working.
Jump to the white-paper download ↓
First, what does the 22% actually mean?
Schneider’s White Paper 521, by Efrie Escott and Will Alpine, compares a traditional building management system (BMS) with a smart BMS and two AI-enabled configurations. Its modeled cloud-AI scenario reduced annual whole-building energy use by 21.7–22.4% against the traditional BMS baseline. The smart BMS alone delivered approximately 9.3–11.8% against that same baseline. White paper, p. 7
READ THE BASELINE BEFORE THE HEADLINE
Two results. One starting point.
Whole-building energy savings relative to the same traditional, schedule-based BMS.
Source: Schneider Electric, White Paper 521, p. 7. Modeled scenarios informed by early pilots; not a guaranteed result for a particular building.
The comparison matters. If your building already has effective occupancy controls, good zoning and well-tuned schedules, you cannot simply apply another 22% reduction to today’s consumption. Some of the opportunity represented in that headline may already have been captured.
There is another distinction worth keeping clear: the 22% figure concerns energy use. The paper also reports carbon savings, which depend on location and the energy sources involved. Those percentages are not interchangeable.
A useful study, with a specific setting
The researchers modeled a medium-sized office in OpenStudio, using Brisbane, Miami and Mumbai as the locations. These are warm, cooling-dominated settings. Model behavior was informed by early pilot deployments; this is not a portfolio-wide measurement of guaranteed savings. White paper, pp. 7, 11 and 14–16
WHAT WAS ACTUALLY STUDIED?
Office prototype
Three floors · approximately 5,000 m² (53,820 sq ft).
Warm locations
Brisbane, Miami and Mumbai. Cooling-dominated conditions.
Configurations
Traditional BMS, smart BMS, smart + edge AI, smart + cloud AI.
Source: White Paper 521, pp. 7, 14–16. OpenStudio models with 2023 weather data and limited pilot validation. Floor-area conversion is rounded.
For a building owner in Denver—or an engineer working on a very different facility in East Africa—that is a starting point for investigation. Weather, operating hours, equipment condition, ventilation needs and existing controls all change the opportunity.
The paper itself calls for more work across building types and climates. It also says the edge and cloud solutions were developed independently, so their results do not isolate architecture as the reason one performed better. I would choose between local and cloud control by looking at connectivity, reliability, support, cost and the actual control task—not by declaring one architecture the universal winner. White paper, pp. 9–11
The useful AI is doing a very practical job
The attraction is continuous adjustment. Occupancy changes. Weather moves. A meeting room fills up while another floor stays quiet. A static schedule cannot respond to every variation.
The systems studied use relatively lightweight machine-learning workloads to improve HVAC operation. This is a useful distinction from asking a large language model to write a report about the building. An explanation can help an operator; a control strategy changes how equipment runs.
Schneider estimates that the AI systems’ operational and allocated embodied emissions were less than 1% of the emissions avoided through improved HVAC performance in these scenarios. That finding has a defined boundary: it includes allocated computing and supporting hardware impacts, and excludes broader effects such as changes in occupant behavior and rebound. It does not establish that every AI application has a small footprint. White paper, pp. 9 and 14–19
Where I would start: make the energy visible
Before discussing algorithms, I want to know what the available data can answer.
A monthly utility bill gives a whole-building total. Interval data adds timing. Submetering can help separate the load being optimized from everything else on the site. BMS points add operating context: commands, temperatures, valve positions, fan speeds and schedules.
These sources serve different purposes. A command to stop a fan does not, by itself, prove that its electrical consumption fell. A falling electrical load does not, by itself, prove that comfort or ventilation remained acceptable.
THE ENGINEERING WORKFLOW
Give the algorithm a feedback loop.
Measure
Meter the energy. Confirm the CT ratios, units and timestamps.
Trustworthy inputsExplain
Connect load to weather, occupancy, schedules and equipment state.
A testable hypothesisAct
Make a controlled change with comfort limits and operator oversight.
A recorded interventionVerify
Compare against an adjusted baseline. Keep tracking the result.
Evidence of improvementChris Mbori’s practical interpretation. This workflow is not a result reported by the Schneider study.
Here is an illustrative troubleshooting question: why is an air-handling unit still drawing power when its schedule says it should be off?
I would line up the meter trace, actual equipment status, occupancy and the control command. A manual override, an incorrect point mapping or an operating requirement could explain the discrepancy. AI can help find the pattern and prioritize the investigation. The engineer still needs enough evidence to make the right change.
This is why the small details matter: correct current-transformer ratios and orientation, consistent units, synchronized clocks, sensible sampling intervals, and a record of missing data. An algorithm cannot reliably optimize a building it is being shown incorrectly.
Four questions before approving an AI pilot
1. What exactly are we measuring? Define the equipment and meter boundary. Decide whether success means lower kWh, lower peak kW, lower cost, or some combination. They are different outcomes.
2. What would consumption have been without the change? Establish a baseline that reflects the relevant weather, occupancy and operating conditions. A cooler month or an emptier building can lower consumption without any improvement in control.
3. What is the system allowed to change? Agree on comfort and ventilation constraints, the operator’s override, fallback control, and a log of interventions. Start with a bounded use case that the facilities team can understand.
4. Will the saving persist? Compare measured use with the adjusted baseline over a representative period. Track comfort, exceptions and performance drift alongside energy. Treat a modeled result as a reason to test, then let site evidence establish the outcome.
That is the engineering approach I would bring to the 22% headline. There may be a substantial opportunity. There may also be basic scheduling or commissioning work that should happen first.
A sensible next step for the monitoring foundation
If your team is exploring AI but cannot yet separate HVAC consumption from the rest of the building, start by mapping the data you already have and the gaps worth measuring. The aim is useful visibility, not a meter on every circuit.
For readers exploring that foundation, AIM Dynamics’ power monitoring and verification range is a practical place to look at meters, current sensors and monitoring packages. ADM Director is another option to explore for bringing compatible meter data into a monitoring portal.
Disclosure: I work with AIM Dynamics. These links are relevant to the measurement side of the discussion; they do not imply that those products reproduce Schneider’s modeled AI savings.
The number that interests me most will ultimately be the one a building team can defend: how much energy it saved, under what conditions, and whether the improvement lasted.
Read the white paper
GO BEYOND THE HEADLINE
Read the original research.
AI for Climate: Quantifying the Energy & Carbon Impact of Building Optimization — Efrie Escott and Will Alpine, Schneider Electric.
Download the white paperOriginal, unmodified PDF · 19 pages · 4.3 MB · Version 1, 2026
Open in your browser · Publisher’s download
Start with pp. 7–9 for results, then pp. 14–19 for assumptions and boundaries. © 2026 Schneider Electric.
The download is the original document supplied for this article, preserved without edits. The charts above are EnergyzedWorld’s own presentation of the cited results and engineering interpretation.
For the original news coverage, read Joe Burns’ report in Facilities Dive, published September 29, 2026. The detailed analysis here uses Schneider Electric’s White Paper 521, Version 1 (2026), especially the scenario definitions, results and appendices.